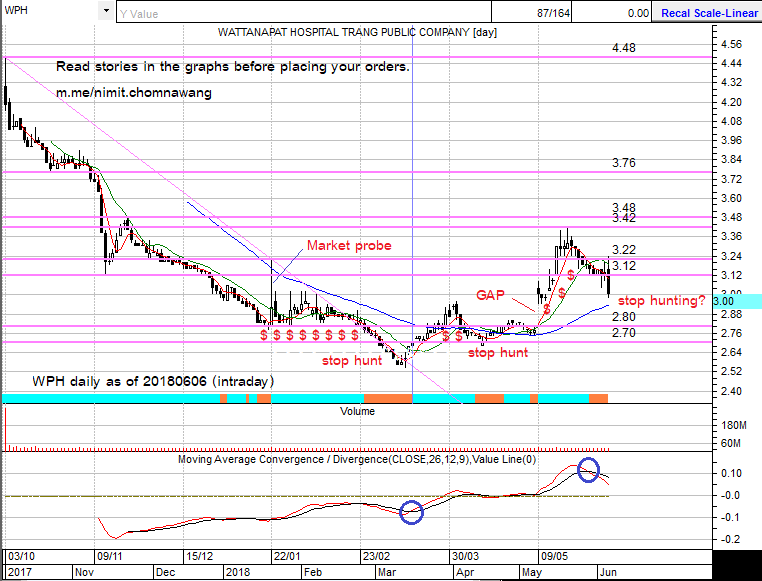
WPH took 6 months to settle before the market makers started their share accumulations. As I have posted about the concept of "stop hunting" for sometimes already, my eyes are now trained to see the locations of stop loss levels. The graph above shows locations of stop loss levels for those investors who entered the market too early. These stop-loss levels had been activated and the market makers had already bought the cheap shares from unwilling sellers. After two rounds of major stop hunting, the MACD indicator had turned from negative to positive zones. The public now has noticed the price appreciation. Since crossing to the positive side of the MACD is an important event in price recovery of a stock. Buying pressure had pushed the price up with a big gap at 2.80 THB. The price shot up over the market probe level occurred in January 2018 and retraced back toward the opened gap. This gap will be closed at 2.80 THB. I have labeled chart structures at various price levels for your investment considerations. From this chart reading, you can see clearly that knowing the stories in the graph helps a lot in planing your investment.
Investors who want to learn how to read market stories from the charts can consult me (Dr. Nimit Chomnawang) at [ m.me/nimit.chomnawang ].